| Latest release |   |
|---|---|
| Status |   |
| Community |   |
| Packages |   |
mdadash is a browser-based real-time dashboard for monitoring, tracking and analyzing running MD simulations using the streaming interface of MDAnalysis.
The dashboard provides an easy-to-use interface to monitor and control simulation progress. It provides several built-in analyses that can be easily added and customized to analyze running MD simulations via real-time plots. There is support for simple frame-local analyses as well as advanced time-dependent analyses like autocorrelations or lag-time dependent observables. In addition to built-in analyses, the dashboard provides a simple framework for researchers to add their own custom analyses through a Notebook interface directly from within the dashboard and customize it for their own use cases. There is also support to display live 3D visualization of the simulation as it progresses.
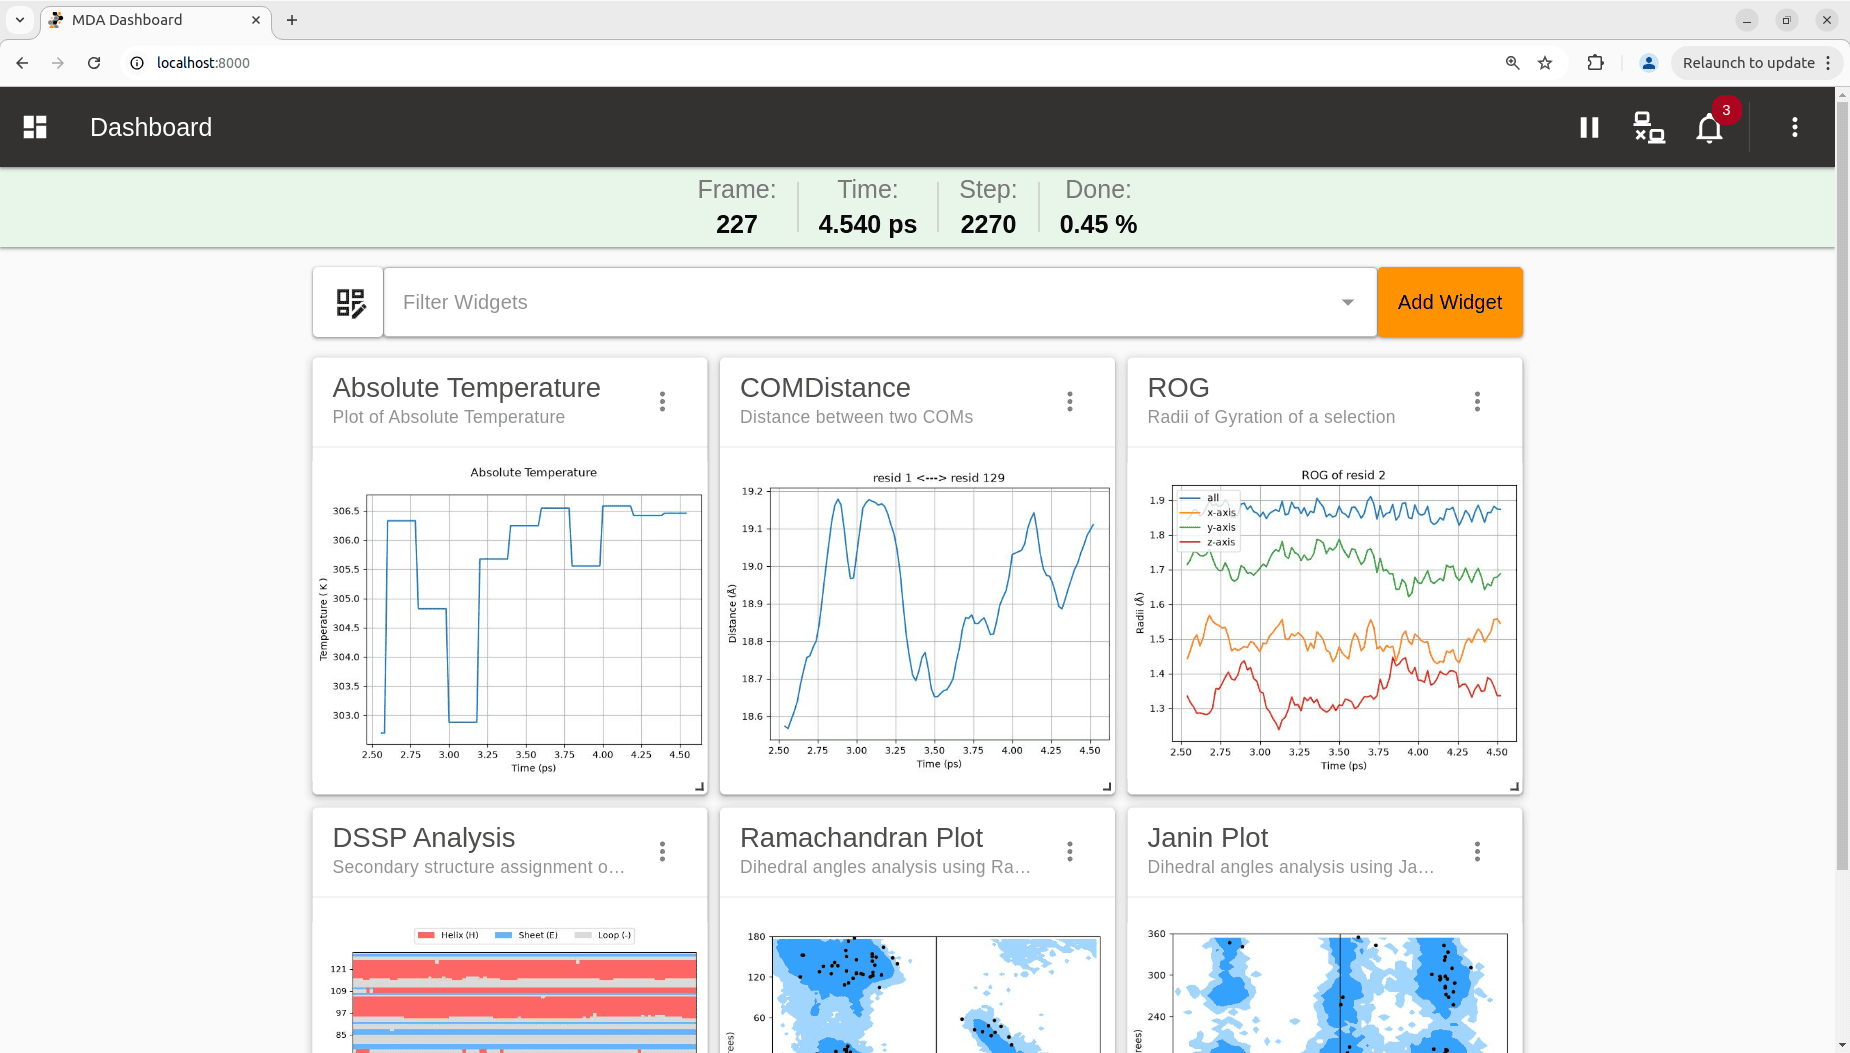
-
Support for IMDv3 (
imd://) as well as file based trajectories -
Multiple built-in analysis widgets
-
See full list in Built-in Analysis Widgets documentation
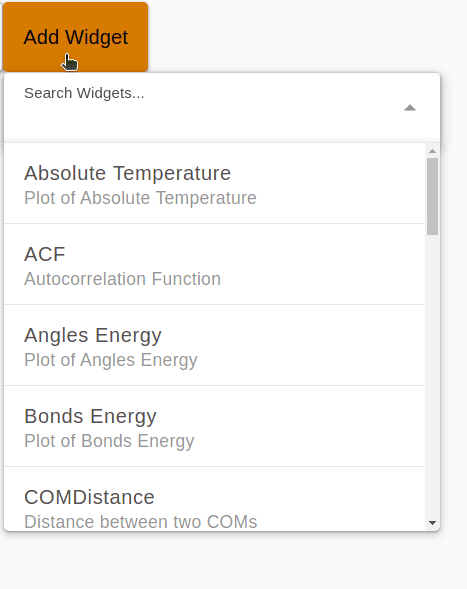
-
-
Customizable dashboard grid layout
-
Real-time plots
-
Simulation control
-
Connect / Disconnect / Pause / Resume
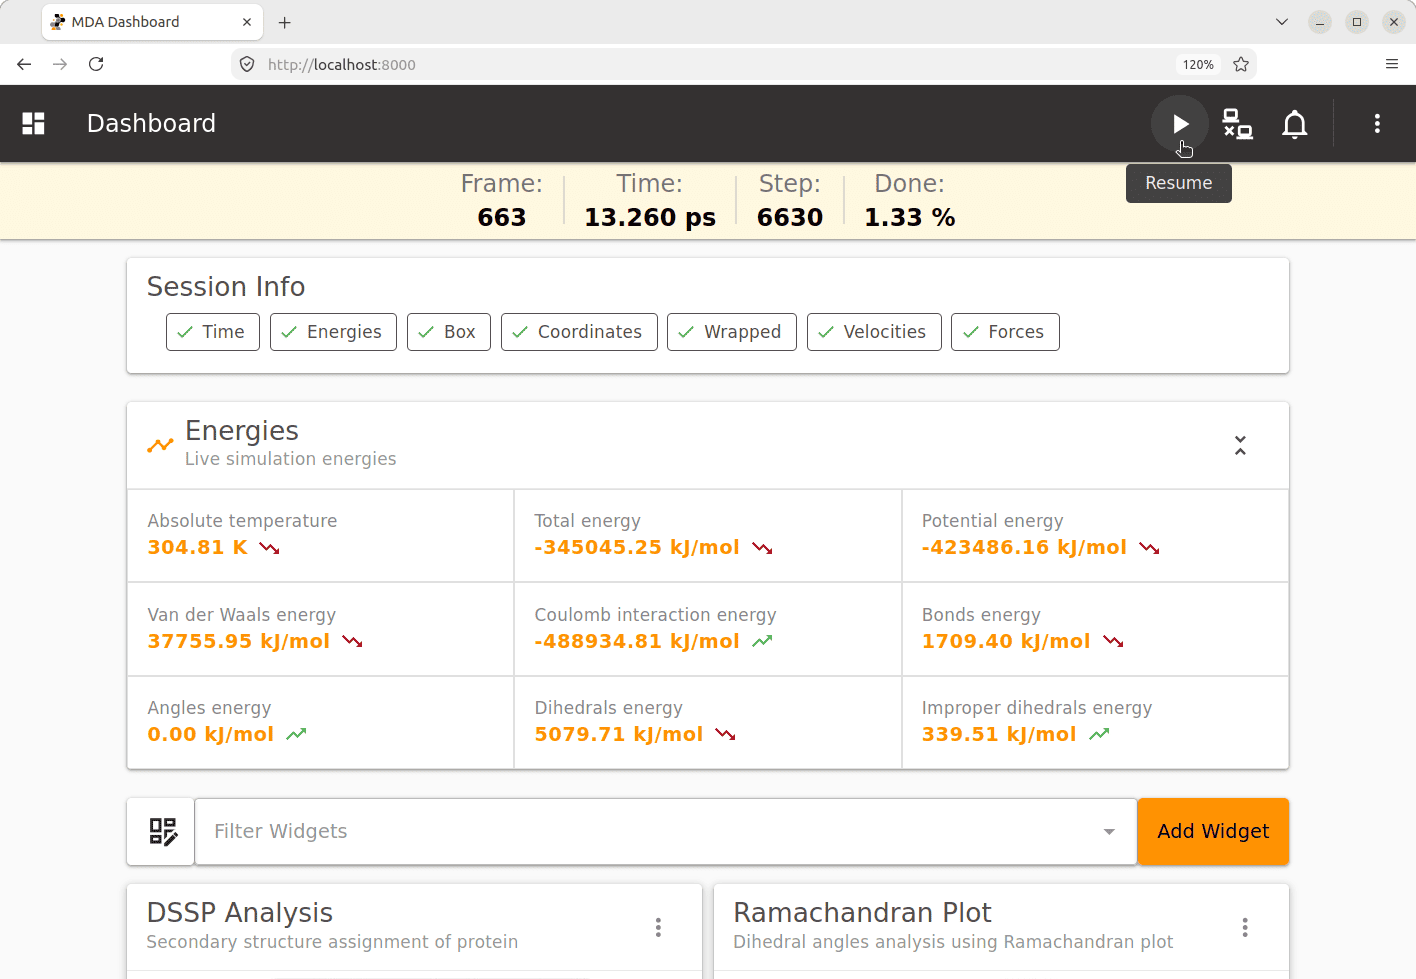
-
-
Custom Code Widget
-
Add custom analysis code
-
See Custom Code Widget documentation
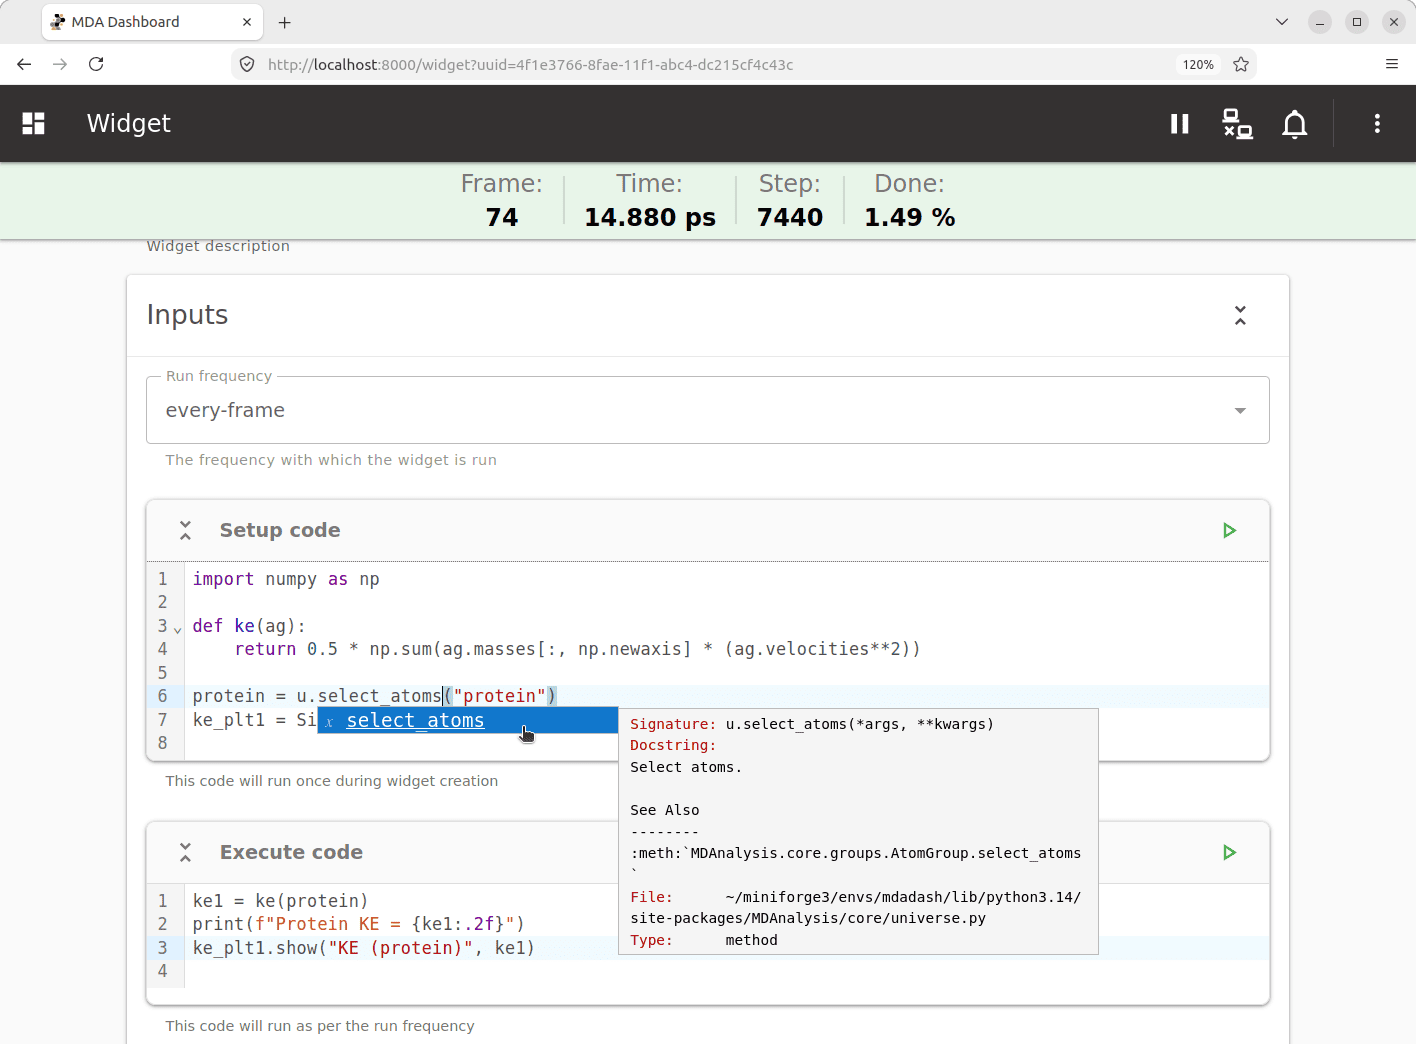
-
-
Custom Analysis Widgets
-
Customize built-in widgets
-
Add your own custom analysis widgets
-
See Adding Custom Widgets in documentation
-
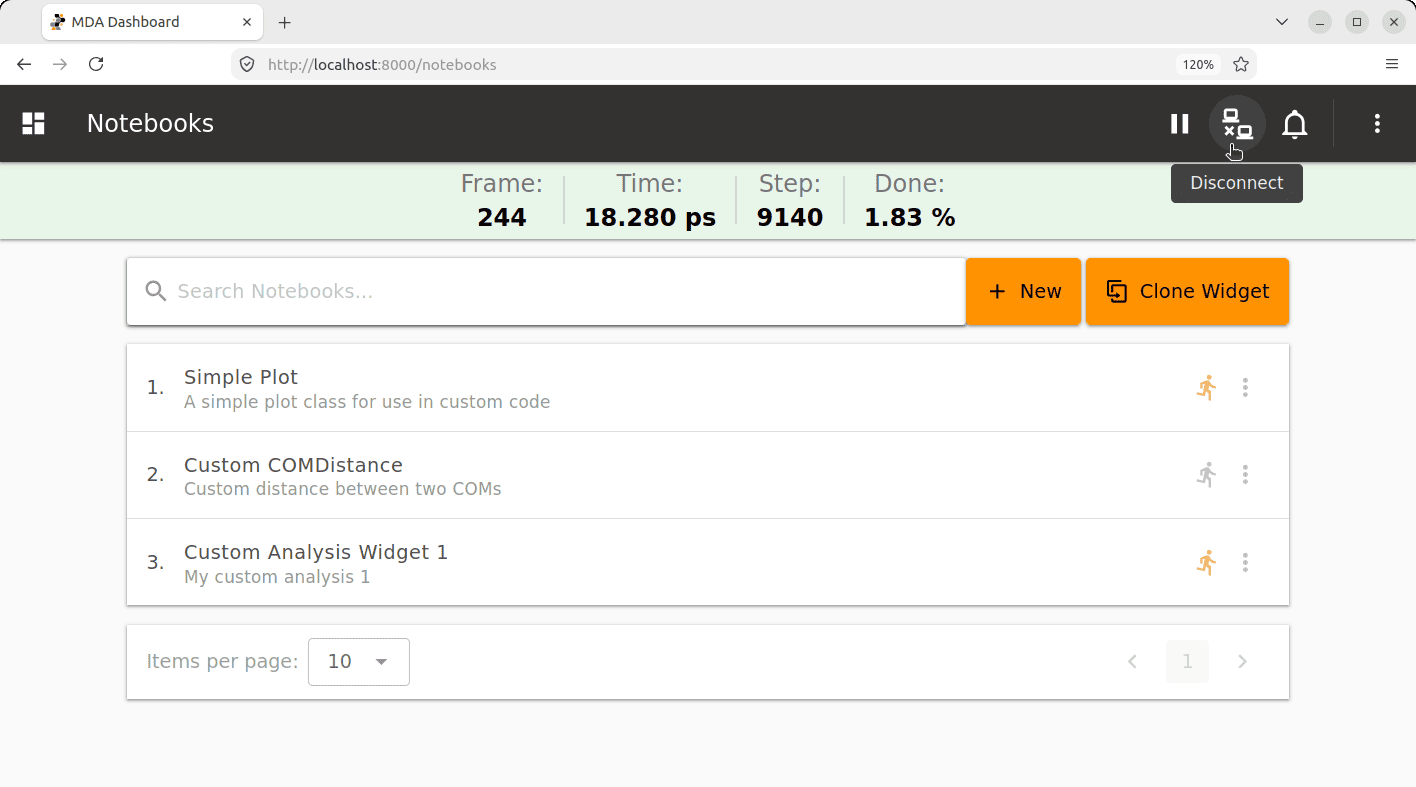
Notebook interface
-
-
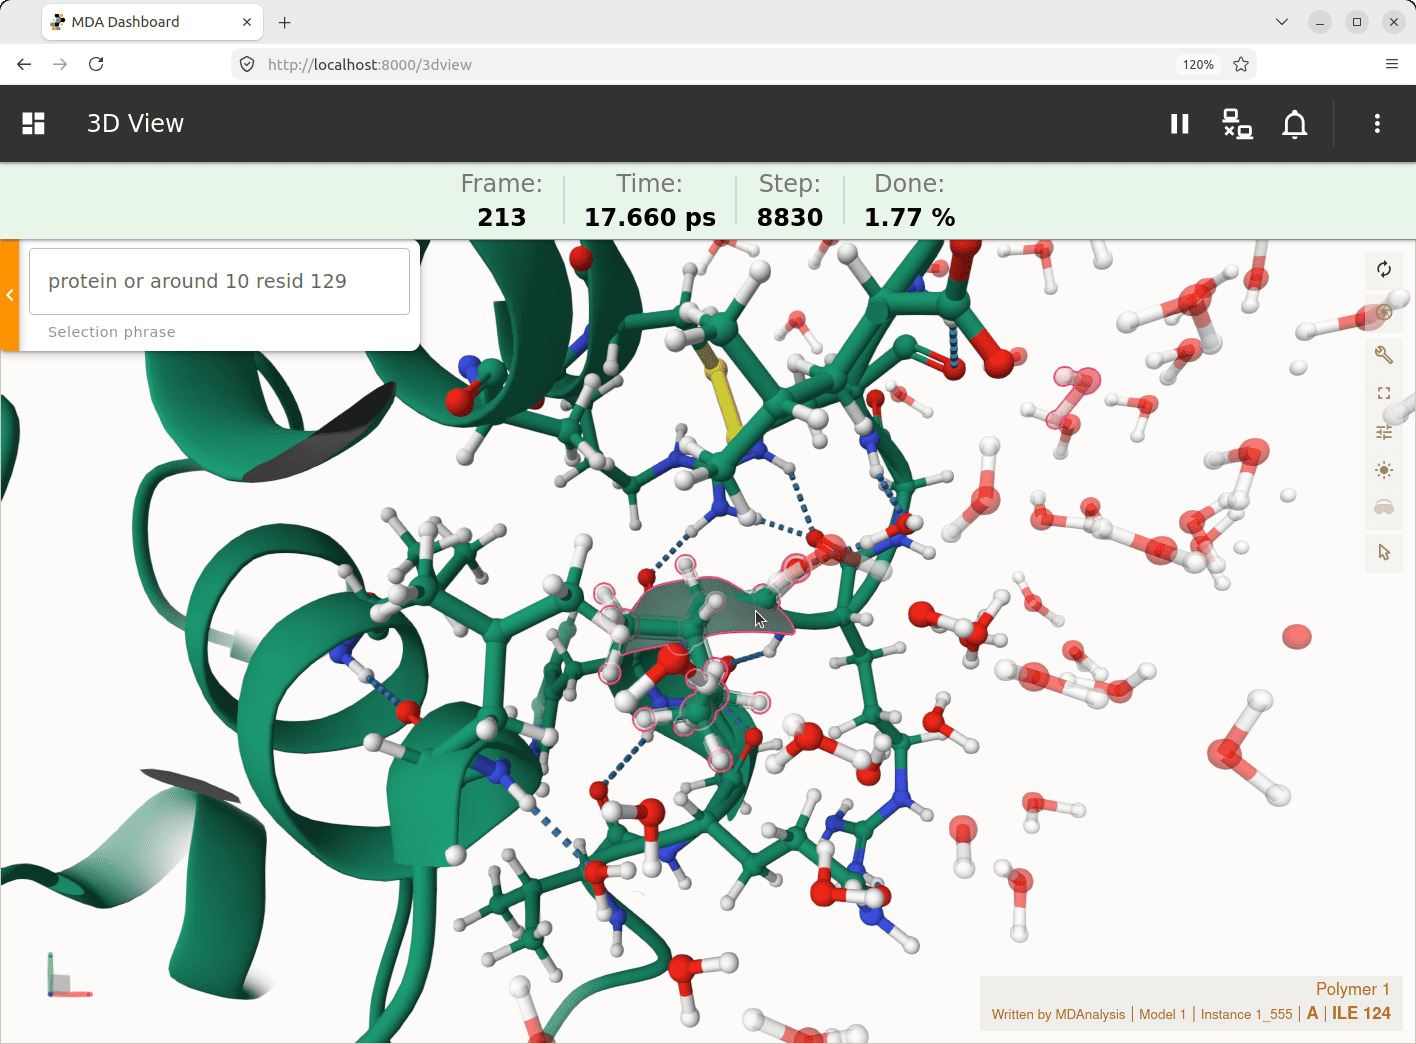
Live 3D visualization
-
Customizable selection
-
Mol * interface
-
-
Alerts
- Notifications when conditions met
- Ability to pause simulation for further analysis when conditions met
-
Batching
- Support for running widgets in batch mode
- Support for buffered access and AnalysisBase based classes
- See Batching in documentation
-
Parallelization
- Support for running widgets in parallel
- See Parallelization in documentation
-
Scalable architecture
- See Architecture in documentation
mdadash can be installed in any of the following ways depending on your Python environment:
pip install mdadashor
uv add mdadashor
conda install -c conda-forge mdadashor
mamba install -c conda-forge mdadashTo execute directly from an isolated environment without installing:
uvx mdadash -hOnce the package is installed, it can be run using the mdadash command to start the dashboard server:
mdadash --topology <topology_filename> --trajectory <trajectory_url_or_file>mdadash supports both streaming and file based trajectories. Here are examples for
both cases:
mdadash --topology topology.tpr --trajectory imd://localhost:8889mdadash --topology topology.tpr --trajectory trajectory.xtcTo see a list of all the available options:
mdadash -h$ mdadash -h
usage: mdadash [-h] --topology TOPOLOGY --trajectory TRAJECTORY [--state-file STATE_FILE] [--clear-alerts]
[--dashboard-port DASHBOARD_PORT] [--dashboard-host DASHBOARD_HOST] [--log-level {DEBUG,INFO,WARNING,ERROR,CRITICAL}] [-v]
Start the MDA Dashboard server
options:
-h, --help show this help message and exit
--topology TOPOLOGY Topology filepath (required)
--trajectory TRAJECTORY
Trajectory URL or file (Eg: 'imd://host:port' or trajectory.xtc) (required)
--state-file STATE_FILE
The dashboard state file (default: mdadash.state.json)
--clear-alerts Clear alerts if any from dashboard state
--dashboard-port DASHBOARD_PORT
Port to run the dashboard server on (default: 8000)
--dashboard-host DASHBOARD_HOST
Host address to bind dashboard server to (default: 127.0.0.1)
--log-level {DEBUG,INFO,WARNING,ERROR,CRITICAL}
Set the logging level (default: INFO)
-v, --version Show the dashboard version and exitThe dashboard can be accessed by navigating to http://127.0.0.1:8000 using any browser.
Note:
Both the dashboard host and post can be customized using the
mdadashcommand line options.Setting
--dashboard-host 0.0.0.0will make the dashboard server accessible from any machine over the network.
Documentation for mdadash is available at: https://mdadash.readthedocs.io/
mdadash is bound by a Code of Conduct.
Developer instructions for this project can be found here.
The mdadash source code is hosted at https://github.com/MDAnalysis/mdadash
and is available under the MIT License (see the file LICENSE).
Copyright (c) 2026, MDAnalysis
Project based on the
MDAnalysis Cookiecutter version 0.1.
Please cite MDAnalysis when using mdadash in published work.